前言
phpstorm 配置 xdebug 是相当的智能了,只要你在 php 环境安装好 xdebug 扩展并配置好信息,安装好浏览器插件 xdebug 后。直接在文件中打断点并开启 listening 基本就能直接监听到进来的请求。之后再弹出配置下网站目录映射即可。
如果不能自动弹出监听窗口,大概率是php.ini的配置文件没有生效。
扩展版本确认
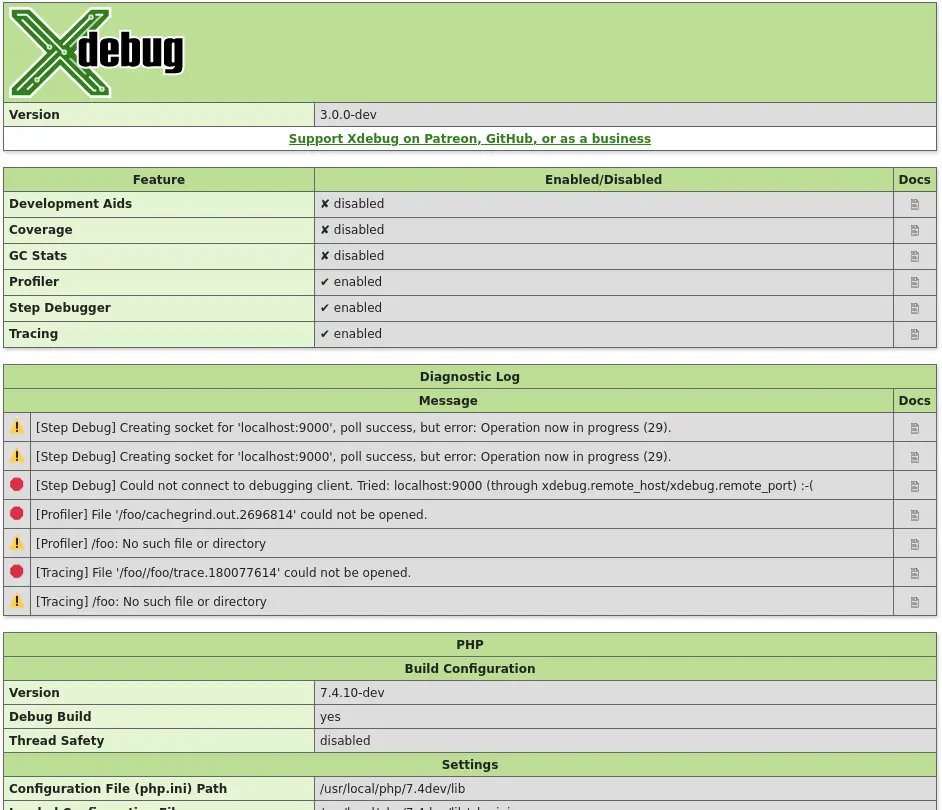
首先确认 xdebug 扩展的版本
php --ri xdebug或使用代码 phpinfo(); 函数来查看
配置文件确认
官方升级文档:Xdebug: Documentation » Upgrading from Xdebug 2 to 3
- XDebug 3.x 之前核心配置
[XDebug]

xdebug.remote_enable=1
xdebug.default_enable=0
xdebug.profiler_enable=0
xdebug.auto_trace=0
xdebug.coverage_enable=0

xdebug.remote_handler = "dbgp"

; docker 环境使用,否则设置为真实 IP 即可
; xdebug.remote_host = 127.0.0.1
xdebug.remote_host = host.docker.internal
; 默认端口 9000
; xdebug.remote_port = 9000

; 设置调试日志位置
xdebug.remote_log = /tmp/xdebug.log- XDebug 3.x 之后核心配置
错误配置xdebug.remote_host
[XDebug]

xdebug.mode=debug
xdebug.start_with_request=yes

xdebug.remote_handler = "dbgp"

; Set to host.docker.internal on Mac and Windows, otherwise, set to host real ip
; xdebug.remote_host = 127.0.0.1
xdebug.client_host = host.docker.internal
; 默认端口 9003
; xdebug.client_port = 9003

; 设置调试日志位置
xdebug.log = /tmp/xdebug.log


SERVER_ENV=develop
3.x 版本还可以直接使用 xdebug_info(); 函数来查看诊断信息